How to Define Metrics to Reach Better Business Outcomes


I often find most organizations think the more metrics they have, the better off they are. Sound familiar? To the contrary, collecting metrics data takes time. If the metrics being reported on are not really valuable, then that time spent collecting data is all wasted time. So, the following is not intended to be an exhaustible list of indicators or instructions. Rather, the intent is to provide context on how anyone can glean information from metrics to demonstrate results toward better business outcomes.
This post focuses on an organization’s desired to have its Scrum Delivery Team predictably meeting its release or milestone commitments.
I will lay out the process in 5 steps.
- Know what outcomes look like.
- Know how to demonstrate key results toward an outcome.
- Know what metrics should be used to measure key results.
- Know where metrics data will originate from.
- Know collection methods and frequency of the metrics data.
Theory: Monitoring Goals
A journal article* from 2016 supports the suggestion that monitoring goal progress is a crucial process between setting and attaining the goal. Additionally, the article* states that progress monitoring had a larger effect on goal attainment when the outcomes were reported or made publicly available, and when the information was physically recorded.
I believe leading indicators are the mechanism by which we monitor goal progress and reviewing that progress frequently by way of dashboards provides the larger effects of goal attainment.
*Psychological Bulletin, Vol 142(2), Feb 2016, 198-229
Assumptions
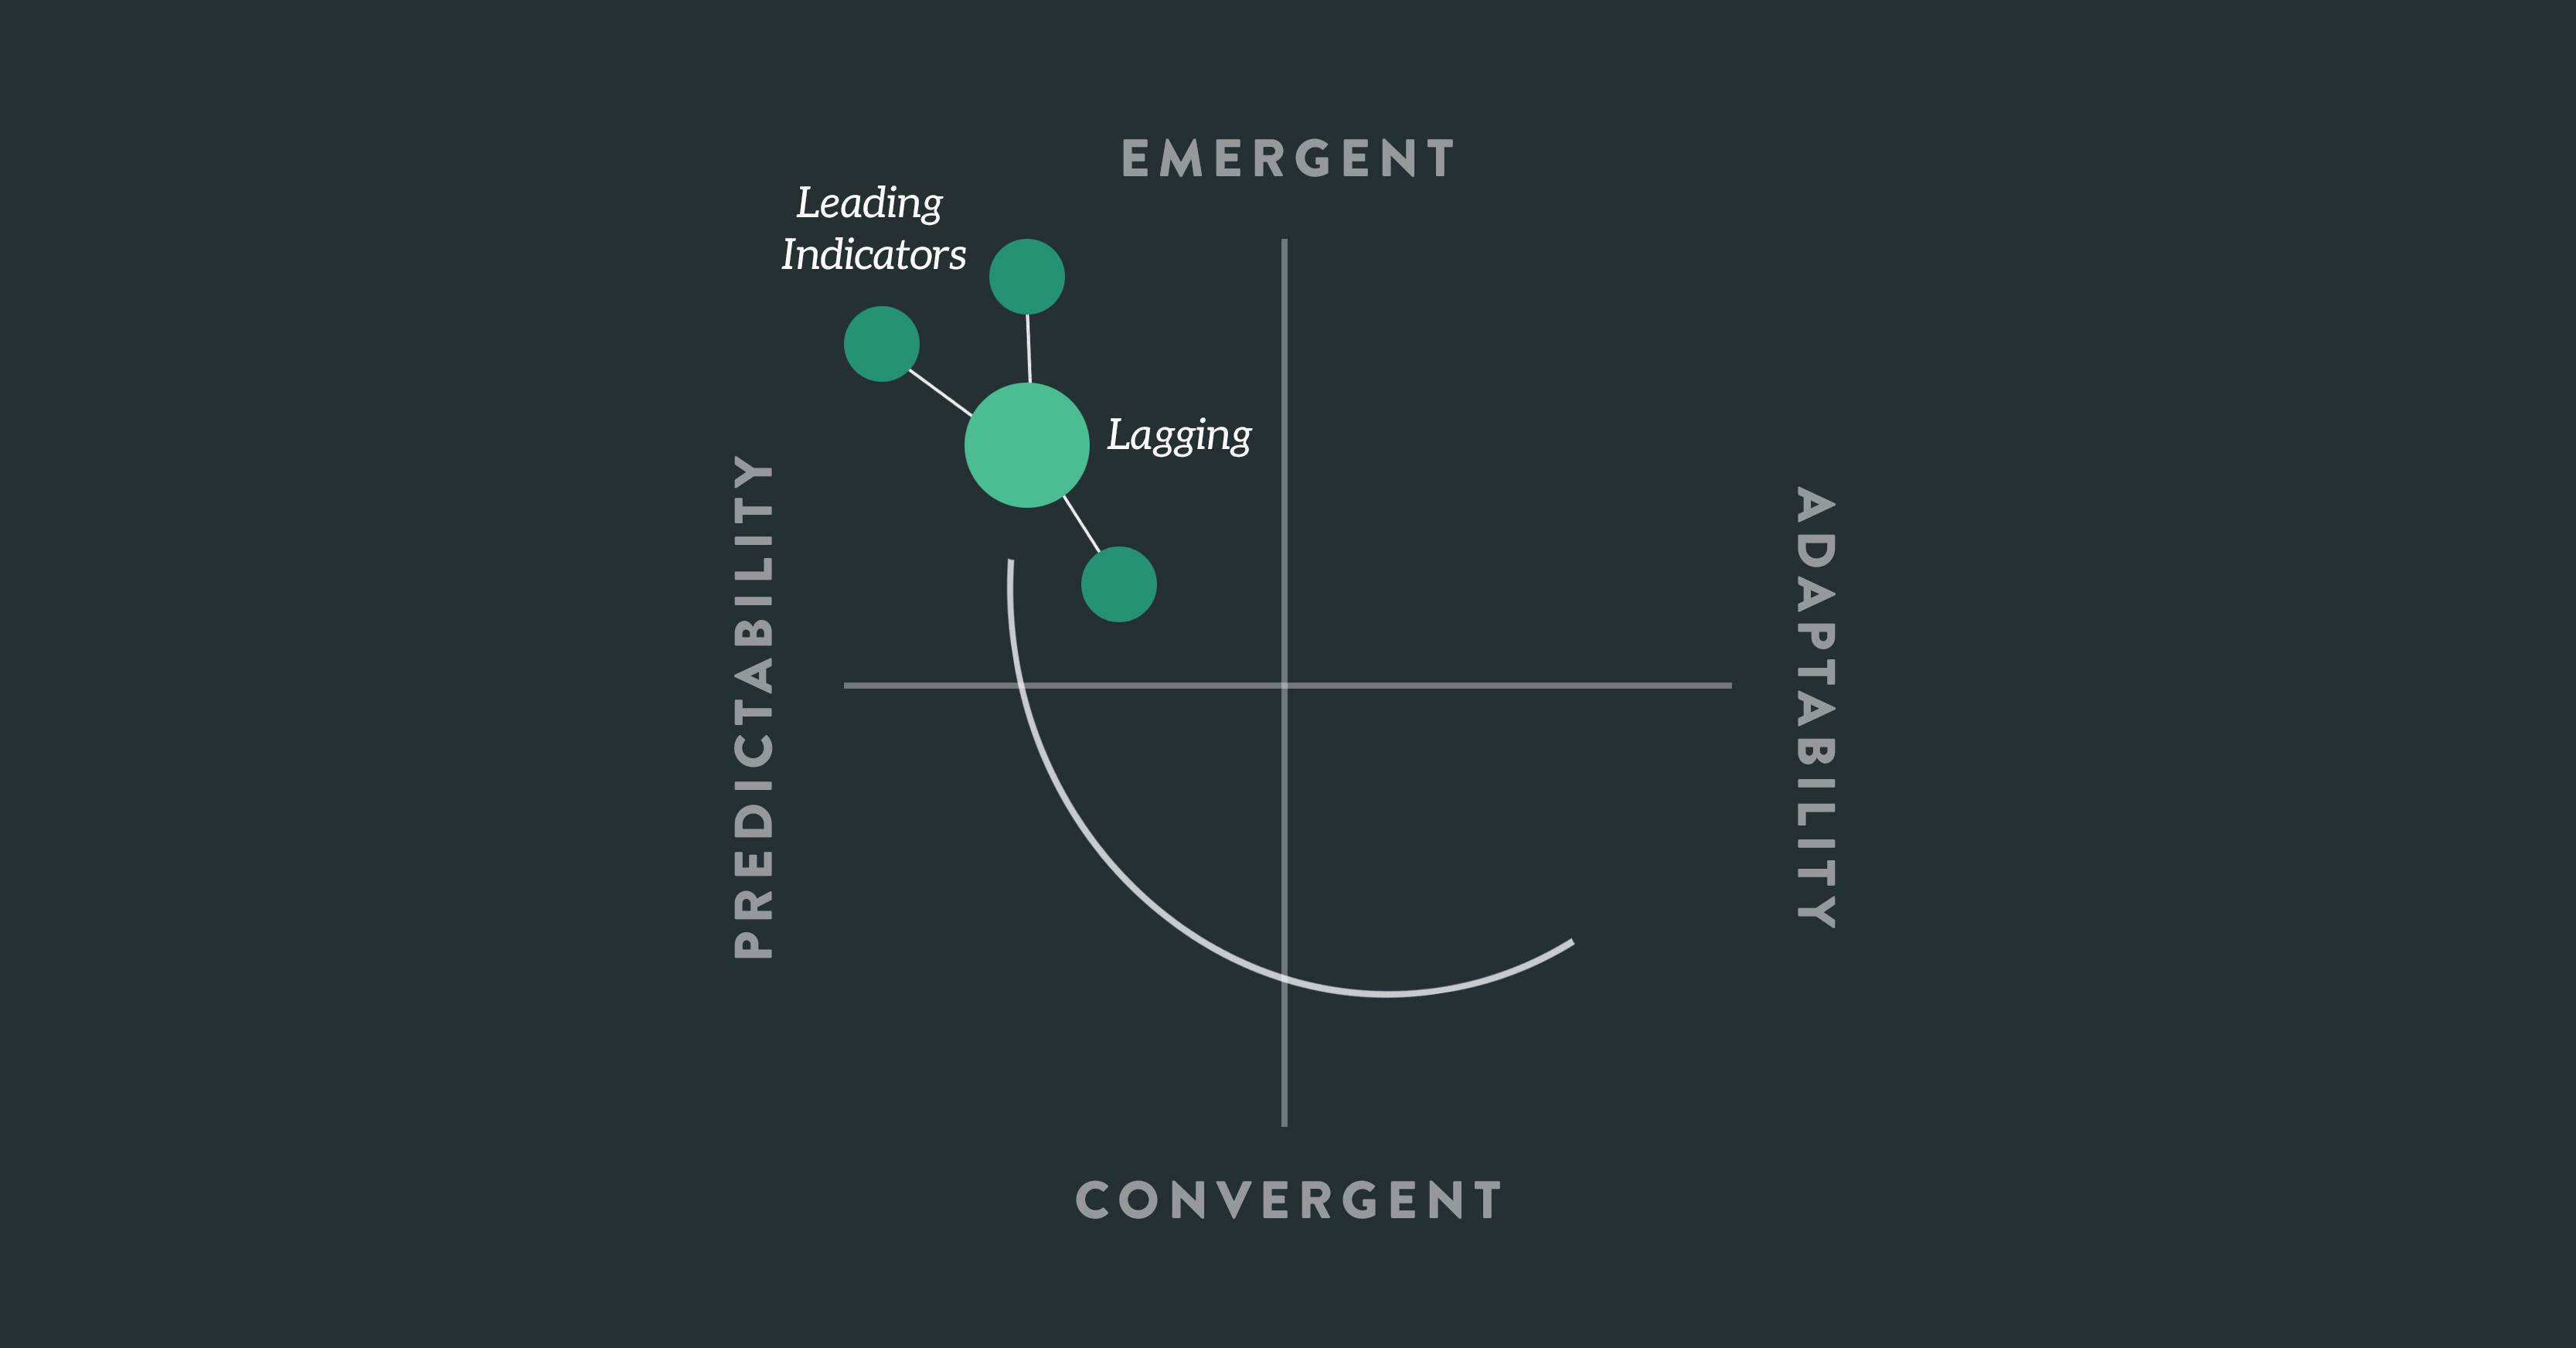
I will assume you are already familiar with LeadingAgile’s Compass. Comparing the planning characteristics of a company with the planning expectations and needs of a client allows us to put your company, or your division, or even just your product area into one of four quadrants. The quadrants help us understand more clearly some of the challenges you might experience meeting customer expectations, why you are struggling or might struggle to adopt agile, and how to talk about the steps necessary to safely and pragmatically move your organization forward.
I am going to focus on organizations that are actually in alignment with their customers expectations, but may struggle making and meeting commitments due to lack of clarity around the requirements, poor estimation, and extreme variability in the rate in which individuals can actually complete work against the estimates. Again, sound familiar? These organizations often have highly structured PMO organizations, very disciplined governance, long-term planning and tracking processes, but still struggle to make and meet commitments on a regular basis.
Goals and Outcomes of Going Agile
Your journey toward greater business Agility starts by identifying what outcomes are most important to your company’s success. This knowledge helps you lay a foundation for making decisions about how to tailor your approach to measurably show progress toward your critical business objectives. For this blog post, our goal is Greater Predictability.
Step One: Define the Desired Outcome
In our example, our desired outcome is to have teams plan, coordinate, and deliver predictably enough to meet a release level commitment.
That’s not too much to ask, right? But what do we need for this outcome?
Backlogs
Backlog items need to be appropriately sized. They need to be ordered and prioritized to capture work needed to develop product or deliverables.
Stable Teams
A stable team has everyone and everything (skill sets, tools, etc.) needed to deliver working, tested, documented, deployable product.
Working Tested Product Increment
This means deliverables meet defined acceptance criteria, have been reviewed and approved by product owner/ stakeholders, have been tested, and are shippable.
Step Two: Align Key Results to Desired Outcomes
For our example, here are two key results:
- The team delivers the committed functionality each sprint.
- There is nothing preventing the team from meeting its commitments.
Step Three: Identify Metrics to Measure the Key Results
The key results are also known as lagging Indicators. The metrics to measure them are known as leading indicators. You can read more about leading and lagging indicators here. The important distinction is that a lagging indicator is one that usually follows an event. You can use the leading indicators to make changes to your behavior or environment, resulting in more positive key results and better outcomes.
- The team delivers the committed functionality each sprint.
- Story Point Completion Percentage
- User Story Completion Percentage
- Velocity Variance
- There is nothing preventing the team from meeting its commitments.
- Team Stability
- The Depth of Ready Backlog
- Outstanding Blockers
Step Four: Know Where to Get The Data
Any of the major Agile ALM tools will provide leading indicators, given you configured the tool correctly and you are consistent on how you (correctly) use it. You just need to know what is a meaningful indicator. Atlassian Jira, CA Agile Central, VersionOne. They all work. Given these, I don’t discount the value of physical boards and spreadsheets. But since most of our customers are struggling with having many teams working in parallel, an ALM tool can pay for itself through less duplication of effort and higher quality of data.
Step Five: Collection Method and Frequency
Let’s use Story Point Completion Percentage as an example leading indicator. Capture key information about the metric, to ensure there is a shared understanding. Metric description, how its calculated, when to measure, acceptable thresholds, and the source location are all critical for us to have a share understanding.
An example would looks like this:
Description:Story Point Completion Percentage measures Delivery Team predictability. It is strongly correlated to the team’s stability and governance ability to manage dependencies. It is paired with the User Story Completion Percentage. Metrics CalculationTotal Story Points (Accepted) / Total Story Points (Committed) When to MeasureCommitted Story points are calculated at Sprint Planning; Accepted at Sprint end. Thresholds≥90% (Green) | 80-89% (Yellow) | < 80% (Red) CA Agile Central SourceWithin an active project, navigate to the Iteration Status page. One of the helpful elements of this page is the ability to see if the team has committed to an appropriate level at Sprint Planning (Planned Velocity graph) and how they are progressing toward the end of their Sprint (Accepted Velocity graph). Point Completion Ratio is calculated by using the AcceptedVelocity graph. (N of N points) |
Summary
That’s it! Start with the outcome first and you lower the chances you’re going to be wasting your time with meaningless metrics. As I noted early, leading indicators are the mechanism by which we monitor goal progress and by reviewing that progress frequently via dashboards, we increase the odds of reaching the goal or outcome. Use the dashboards provided in your ALM tool or build your own.
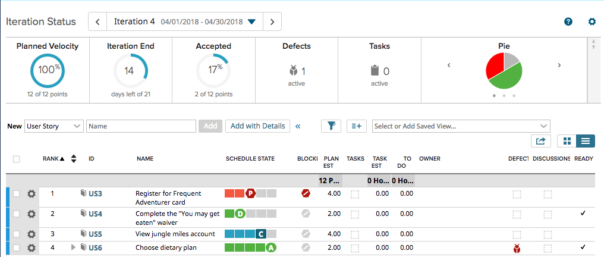
Story Point Completion Ratio in CA Agile Central
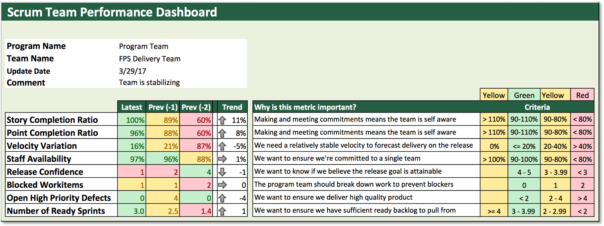
Scrum Team Dashboard via LeadingAgile