Process Cycle Efficiency (PCE) Metric


What is Process Cycle Efficiency?
Process Cycle Efficiency, also known as “Flow Efficiency” or “Value Add Ratio,” is a measurement of the amount of value-add time in any process, relative to lead time (the time between the initiation and completion of a production process). The higher the ratio, the more efficient your process. This metric quantifies waste throughout a system of delivery. One form of waste I want to bring attention to is waiting.
Why is this important?
Particularly in application development in large organizations, we often spend more than 95 percent of our time waiting. First, let’s start by identifying where we are waiting, by using value stream mapping. A software development value stream typically goes something like this: design, develop, test, and deploy. That’s pretty much everything you need to develop a working tested increment of the product. Simply put, value-added time includes those activities. Non-value-add (wasted) time would include waiting to do those activities.
When should you use Process Cycle Efficiency?
When you believe your lead time is too long and you’re not sure where the bottlenecks are. Once you have exposed the waste in the form of wait queues, you can work to reduce their duration or frequency.
What do you need to calculate PCE?
At a minimum, you should
- Map your value stream
- Identify value-add processes (states)
- Identify wait queues for value-add processes
- Have a method to calculate time work items are in each queue or state
Calculation formula for PCE
- Lead Time = Value-Add Time + Non-Value-Add Time
- Process Cycle Efficiency in % = Value-Add Time / Lead Time
- Value-Add Time = Time spent in ‘In-Progress’ process states. (Designing, Developing, Testing,…)
- Non-Value-Add Time = Time work sits in the backlog, the time work is waiting for value-add work to begin, and of course, it includes the time work is blocked. Let’s also not forget time work is sitting because defects are being remediated.
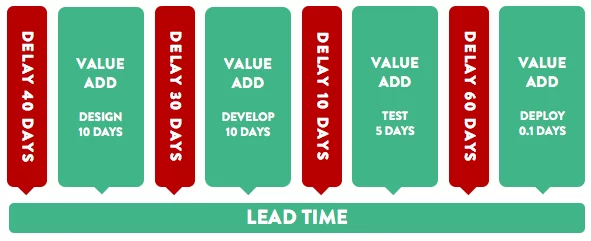
Referencing graphic at the beginning of the post:
- Lead Time = 155.1 days
- Design+Develop+Test+Deploy= 15.1 days of value-add time & Delays (waiting) = 140 days
- 15.1/155.1 = 9.7% PCE
Why I love PCE and why I hate it
Regardless of your business or technical process, it’s very eye-opening to discover how much time is wasted, relative to actual valuable activities.
I love to show a customer where the biggest delays of their overall delivery system are. If you can do that, you can take concrete steps to improve them. I love that the mystery of lost time is gone. There is nowhere for the waste to hide. You are actively seeing it.
What do I hate about PCE? It’s time intensive to collect data related to it. “I” have yet to automate an ALM tool, dashboard, or report that we can easily tag queues and process states as value or waste. Until I do that, we have to look at every work item in the system and manually track and measure the times of that work progressing through the system. It’s not too bad on a team level, when work will flow in and out in just a few weeks. It’s much harder (but more valuable) when you’re looking at a program or portfolio. The major challenge is the lead time can be months or even years. But by looking at work on that level, we have the greatest opportunity for improvement.
Comments (2)
Joe
If I read this correctly, shouldn’t the example PCE be 16.1
Ben
Lead Time = 165.1 days
Design+Develop+Test+Deploy= 25.1 days of value-add time & Delays (waiting) = 140 days
25.1/165.1 = 15.2% PCE